Guide: Understanding Your Phishing Report
Your Phishing Campaign Report summarises how learners interacted with a simulated phishing email. The key metrics below help you understand your organisation’s risk level, learner behaviour, and areas for improvement. *Learners refer to the recipients of the simulated phishing email.
PDF Report
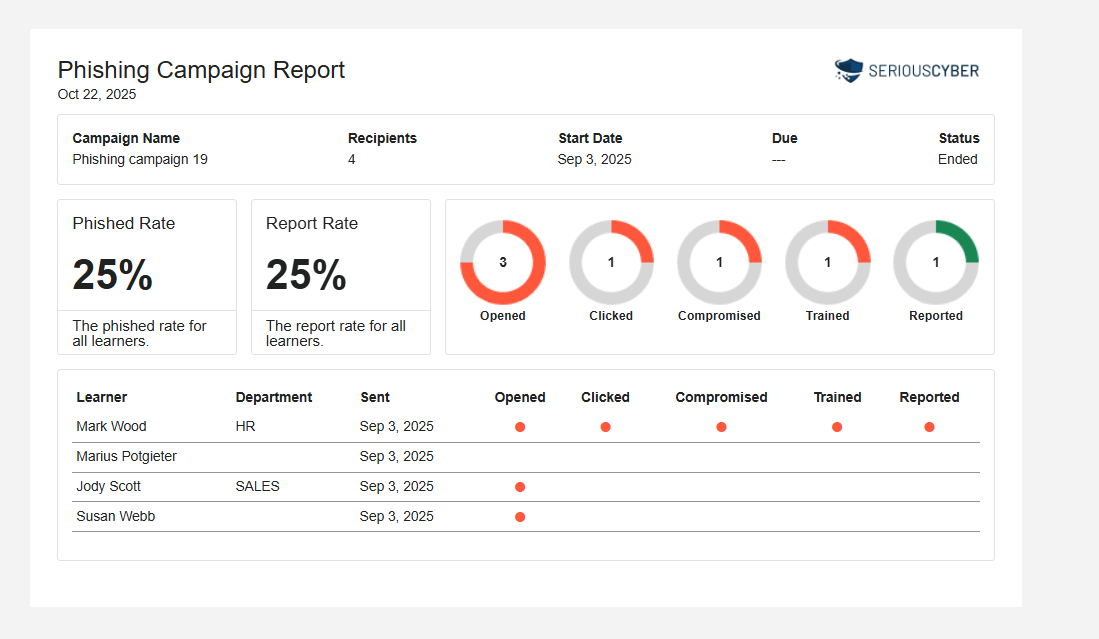
Phished Rate: The percentage of learners who interacted with the malicious part of the email (clicked on a link, opened an attachment, or entered data).
Report Rate: Your defensive strength score. It measures how many learners spotted and reported the phishing email as suspicious.
Opened: The number of learners who opened the phishing email. (tracked by image load)
Clicked: The number of learners who clicked on a link or an attachment within the email.
Compromised: The number of learners who shared information by entering data (e.g., login credentials) into a landing page.
Note: "Clicked" shows initial interaction, while "Compromised" indicates a further step where the learner might have divulged information, potentially leading to a security breach.
Trained: The number of learners who completed the just-in-time training sent to them after failing the test (e.g., by clicking or compromising).
Reported: The number of learners who correctly identified and reported the email (via dedicated mailbox or reporting button).
Campaign Overview
If you are looking to review specific information related to a specific phishing campaign, such as timestamps, this can be done from your "My Company" Dashboard.
- Scroll down > Click on the specific Phishing Campaign you want to review
- Click View Campaign to enter the campaign overview.

- Use the Expand Statuses button for detailed timestamps of each action.


Generating Phishing Reports
To download a report from the campaign overview page, follow these steps:
- Click Reports in the top-right corner of the campaign overview.
- Choose format: CSV or PDF
Note: If you need to share campaign progress with department managers without giving them full platform access, download the report as a CSV, filter it by department, and share the filtered file. This applies to both Phishing and Training campaigns, so each manager sees only their team’s progress.
Next Steps
Your report highlights both vulnerabilities and positive security actions. Use these insights to:
- Identify learners or departments who need extra phishing awareness training.
- Recognise those who reported all suspicious emails to reinforce positive behaviour.
- Track changes in your Phished Rate and Report Rate over time to measure progress.
For more info on Phishing Campaign reports, see our Guide: CSV Reports for Phishing Campaigns